Related Topics
Users of Process Director v4.0 and above have access to the Chart object. The Chart object displays a graphical representation of values from Knowledge Views and Business Values to enable easier dashboarding—from either the Process Director interface, or in Forms—without needing the more advanced capabilities of the Advanced Reporting component.
Configuring a Chart #
Obviously, a chart can show many different types of data, and the data can be quite complex. For the purposes of this documentation topic, we'll use a simple Business Value that returns two columns of data, a Symbol column that contains the stock symbols for a number of companies, and a Quantity column, with the number of shares of each stock in the portfolio.
Just as with any other Process Director object, to create a new chart, select "Chart" from the Create New... dropdown located in the upper right corner of the Process Director interface. The New Chart screen will appear, enabling you to enter the Chart Name for your new chart. When you click the OK button, the new Chart object will be created, with the name you've entered. The Chart's options screen will then be displayed, and you can enter a fuller explanation of your chart's purpose in the Description field.
The remainder of the options screen consists of several tabs, each of which enable you to configure different aspects of the chart.
Properties Tab #
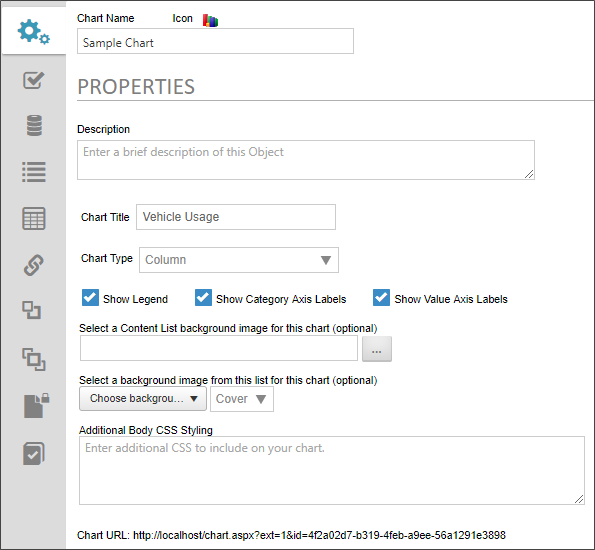
The Chart Options section is where you'll set the overall configuration of your chart.
 Chart Title
This is the name that will appear in the Chart's Title area. The Chart's title can use System Variables, which Process Director will parse to display properly.
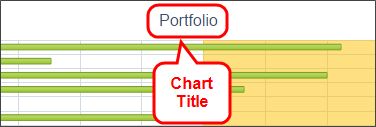
Chart Type
You can select the type of chart you wish to display from this dropdown control. The available Chart types are:
- Area
- Bar
- Column
- Pie
- Donut
- Line
- Linear Gauge
- Radial Gauge
- For Process Director v 6.0.100 and higher, a new chart type, the Gantt Chart, is also configurable.
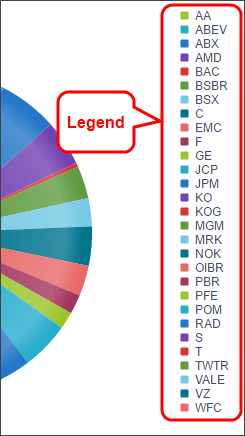
Show Legend
Checking this box will display the chart legend.
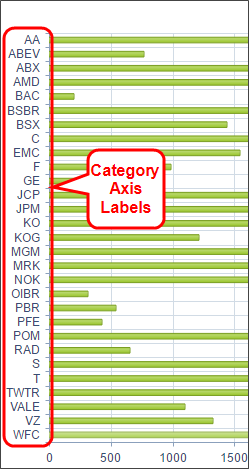
Show Category Axis Labels
Checking this box will display labels for the category axis.
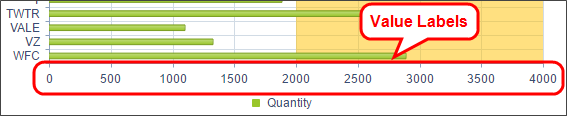
Show Value Axis Labels
Checking this box will display labels for the value axis.
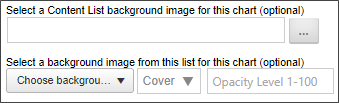
Select a Content List Background Image for this Chart
You can select an image from the Content List that will display as the background image for the chart.
Select a background image from this list for this chart (optional)
This option enables you to select an image from a dropdown control that contains a number of stock background images, and will use that image as a background image for the Form.
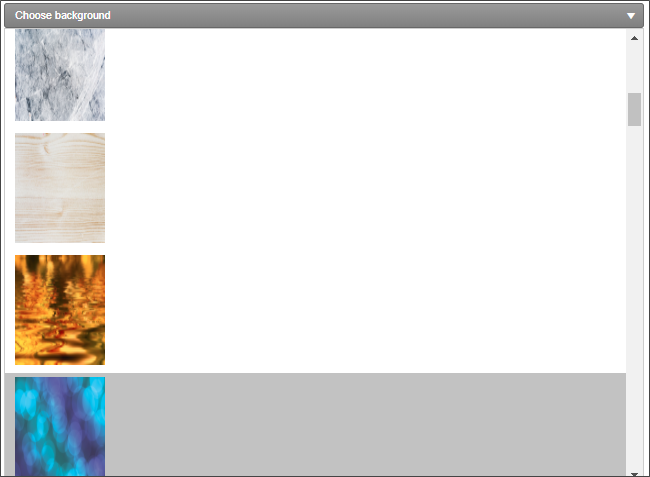
Next to the image dropdown, an additional Background Image Sizing dropdown enables you to specify how the background image will appear on the form. The following options are available:
- Cover: The image will expand to fill the entire page background.
- Center: The image will appear in its actual size, centered on the page vertically and horizontally.
- Tile: The image will appear in its actual size, aligned to the top left of the window, and will tile vertically and horizontally.
- Tile X: The image will appear in its actual size, aligned to the top left of the window, and will tile along the X-axis only.
- Tile X: The image will appear in its actual size, aligned to the top left of the window, and will tile along the Y-axis only.
Finally, an Opacity Level property enables you to set the opacity percentage by setting a value from 0 to 100.
Additional Body CSS Styling
You can apply CSS styles to the chart to control the visual properties of the chart's body, such as background colors, etc.
Options Tab #
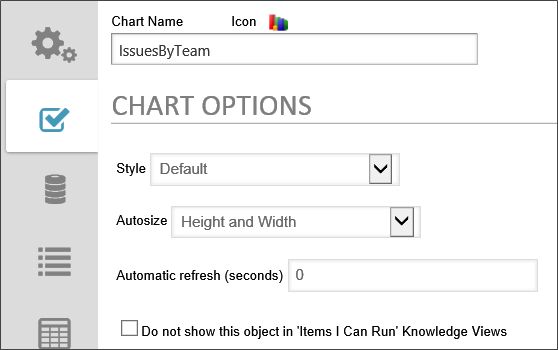
Style
You can select a large number of different visual color styles for your chart from this dropdown.
Autosize
You can set the autosize options for your chart so that it displays properly in different viewports that display in different sizes. The available options are:
- Height and Width
- Height Only
- Width Only
- Fixed Size
If you choose "Fixed Size", Width and Height settings controls will appear that enable you to set a specific height and width, either as a percentage of the viewport size, or in a fixed number of pixels.
Automatic refresh (seconds)
You may enter the number of seconds you'd like to pass before the chart auto-refreshes with the most recent data. The default value for this setting is '0". When the automatic refresh is set to "0", the chart won't auto-refresh.
Do not show this object in 'Items I Can Run' Knowledge Views
Checking this option will hide the Chart from the Items I can Run Knowledge View.
Chart Data Source Tab #
For most Chart Types, Process Director presents a fairly simply set of Data Source Properties.
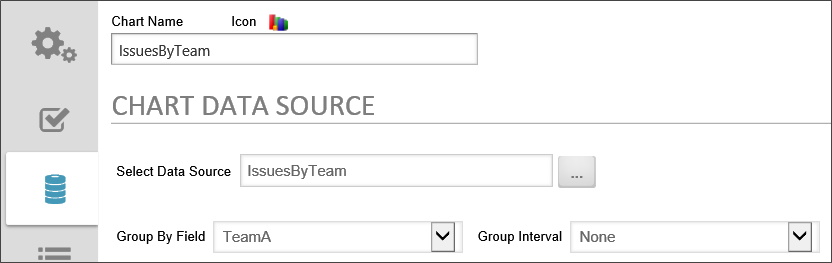
This section of the options screen enables you to specify the data source for your chart. You may choose either a Knowledge View or a Business Value as the data source.
Select Data Source
This Object Picker enables you to browse through the Content List to select the data source object for the Chart. You can choose either a Business Value or a Knowledge View as the data source for the Chart.
Group By Field
Once you've selected a data source, this dropdown control will display all of the columns in the data source. Selecting a column will set that column as the X-Axis of the chart, and will group all of the Chart's Y-Axis values by the column value that you select here.
Group Interval
If the chart column is date-based, you can set the time interval you'd like to use to add an additional grouping by date. The available options are:
- None
- Minute
- Hour
- Day
- Day of Week
- Week
- Month
- Year
- Quarter
Show Axis Labels with No Values
For Process Director v5.44.1100 and higher, this property appears when you select a grouping level for which some groupings will produce no values, e.g., grouping by hour, when some hours have no data. Checking this property box will display the empty group with the appropriate group label and a 0 value for that group on the chart. If this property box isn't checked, the chart will skip that group in the series, and the 0 value won't be displayed on the chart, which is the default behavior.
Gantt Charts
 This topic is a work in progress for the future release of Process Director. It is subject to change without notice until release.
Gannt Chart (Legacy)
For Process Director v 6.0.100 and higher, the Gantt chart was added as a selectable Chart Type. The Gantt chart has several additional properties on this tab, which specifically enable you to display Gantt charts.
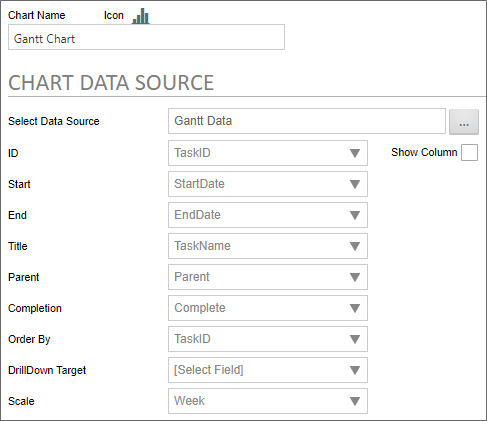
To properly construct a Gantt Chart, the data you use must contain several data fields that can be assigned to each task that will be displayed on the Gantt chart. These properties are associated with the different data source properties of the Gantt chart via selecting them from this tab. The data source should contain fields that specify the following elements:
- Task or item ID
- Start date
- End date
- Task name or title
- The ID of the parent task
- The completion status of the task
- And, finally, an optional grouping field
Assuming that all of the correct data fields are present, the data source properties below can be fully configured.
ID
The data field used to provide the ID of each task.
Show Column
This checkbox will, when checked, display the Task ID as a column in the Gantt Chart. This property is unchecked by default.
Start
The data field used to provide the start date for each task.
End
The data field used to provide the end date for each task.
Title
The data field used to provide the title or name for each task.
Parent
The data field used to provide the ID for each task's parent task.
Completion
The data field used to provide the completion status for each task. This fields data should be in percentile format, e.g., "75%", rather than in decimal format, e.g., "0.75".
Order By
The data field used to specif the order in which each task is shown, from top to bottom.
Scale
The calendar element you'd like to use for the overall cale of the Gantt chart, e.g., Day, Week, Month, etc.
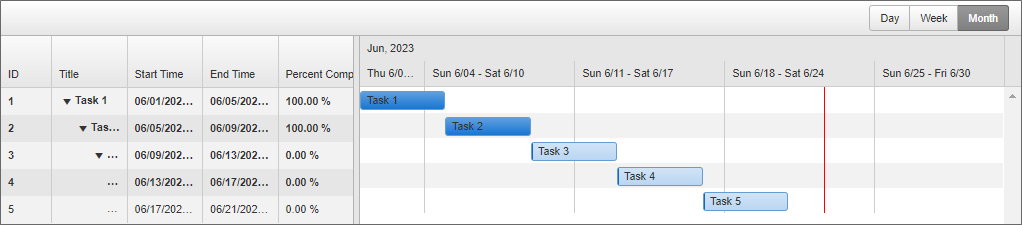
When properly configured, the Gantt Chart can be displayed with all of its appropriate data.
Gantt Chart
For Process Director v6.1.200, an updated version of the Gantt Chart was introduced. The Gantt Chart from previous versions was renamed Gantt Chart (Legacy) while the updated version was named Gantt Chart. The legacy chart is retained for backwards compatibility.
In the newer version of the Gantt Chart, the Chart Data Source tab contains the same properties as the legacy version, though some new properties have been added.
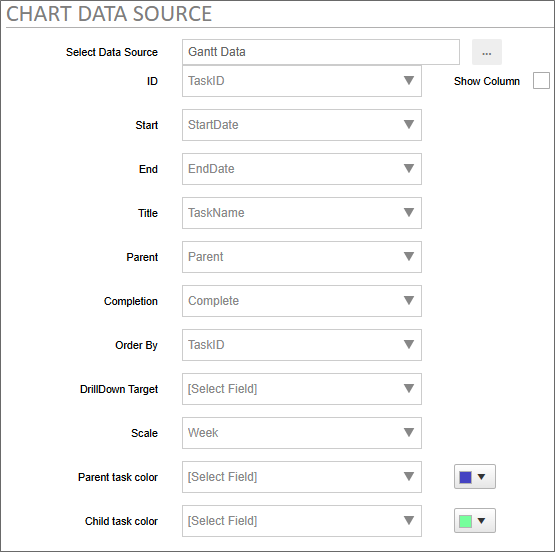
The Parent/Child task color properties enable you to set the bar colors for parent and child items. You have the option of either 1) including the color values in the underlying data source, or 2) manually setting the colors via the color selectors for each item. Selecting a field from your data source will override any manual colors you set.
The visual appearance of the Gantt Chart has also been updated:

This version of the Gantt chart also has additional functionality not included in the legacy version.
- An Export to PDF button will export the Gantt Chart to a PDF file.
- An Export to PowerPoint button will export the chart to a PowerPoint presentation as an embedded graphic.
- An Expand/Collapse All button will expand or contract the parent/child view of the Gantt chart to show/hide child items.
- The Zoom In/Out buttons enable you to change the view to display smaller or larger time increments, while the Reset Zoom button will return to the default increment specified for the Gantt chart by the Scale property configured on the Chart Data Source tab.
- The Default/Compact buttons will change the vertical height of each time to a larger or smaller value to enable more items to be displayed vertically on the screen.
- The Milestones button will show/hide milestones in the Gantt chart.
- The Week and Month buttons will set the display increments to weekly or monthly.
Chart Series Tab #
You can add multiple data series to a chart by clicking the Add Series button for every data series you'd like to add. The series entries can be orders by clicking the up/down arrows on the right side of the tab, and a series can be deleted by clicking the red "X" icon.
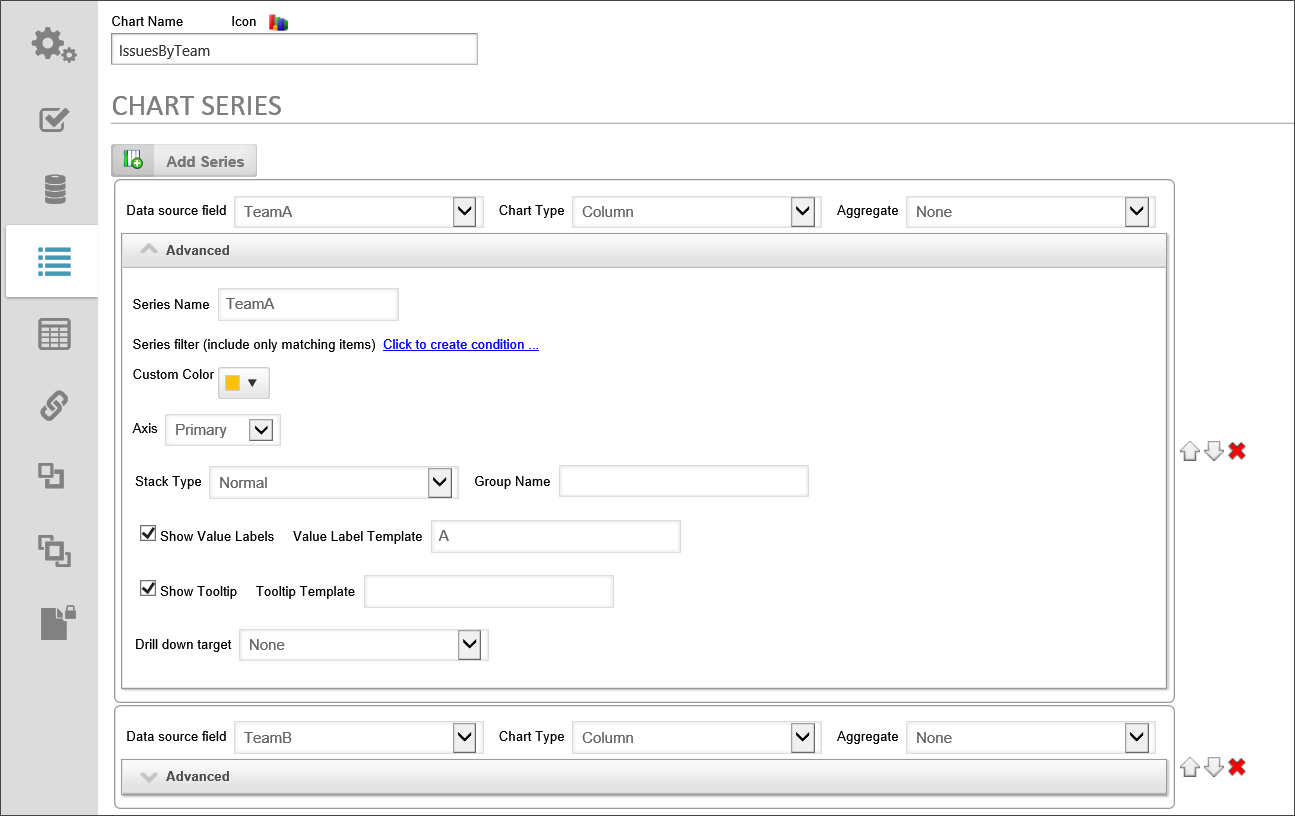
This section enables you to set the properties of the Chart's values. This section is where you configure the Y-Axes for the chart. You can have multiple series and generate combination charts.
Data Source Field
The field that contains the Chart's data. This Field is selected from a dropdown control. A condition can also be set to show the series under whatever evaluable condition the user desires.
Chart Type
The Chart Type setting will only be displayed when the Line, Area, or Column Chart Types are selected in the Chart Options section. If you choose the Column, Line, or Area chart types in the Chart Options section, then you may choose either Column, Line, or Area as the Chart Type for your chart. You can, therefore, have multiple Y-Axes, in which case you might wish to display each Y-Axis differently. For example, you might wish to have one series display as a column, and a second series display as a line, in order to create a combination chart.
Aggregate
You can aggregate the values in the Y-Axis by using one of the following mathematical aggregation functions:
- None: No aggregation will be applied.
- Count: The number of records that match a given Group value.
- Sum: The sum of all records that match the Group value.
- Average: The average value of all records that match the Group value.
- Min: The lowest value contained in all records that match the Group value.
- Max: The highest value contained in all records that match the Group value.
- Average Exclude 0: The average value of all records that match the Group value, excluding those records that have a zero value from the calculation.
- First: The first value contained in all records that match the Group value.
- Last: The last value contained in all records that match the Group value.
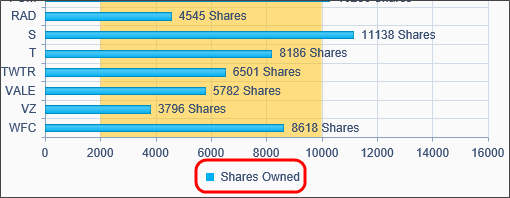
Series Name
You can enter a name for the chart series, which will appear as the title of the series in the Chart Legend.
Series Filter
You can click the Condition Builder link to create a condition to use to filter the data series.
Custom Color
You can select a Custom color to display for the series by selecting the custom color from a color selector.
Axis
This dropdown enables you to set the Value as the primary or a secondary Y-Axis. Charts can have multiple axes, and chart styles with multiple aces can be displayed as combined charts, e.g., column and line charts with primary and secondary axes.
Stack Type
This setting enables you to set the stack type for stacked bar and column charts. The available stack types are:
- None
- Normal
- 100%
When a stack type other than "None" is selected, the Group Name text box will appear, enabling you to label each group type in the stack.
Missing Values
For certain types of chart, such as line charts, this dropdown control provides options on how you'd like the chart to display missing values in the data. The following choices are available:
- None: The missing data isn't displayed in the chart, and the chart series skips the display of these data points so that the remaining data points are displayed seamlessly without a gap in the data.
- Gap: Display a gap in the chart where the missing data should be.
- Zero: Display the missing data as having a value of 0.
- Interpolate: Missing data will be displayed as having a value that is the median between the prior and subsequent data points.
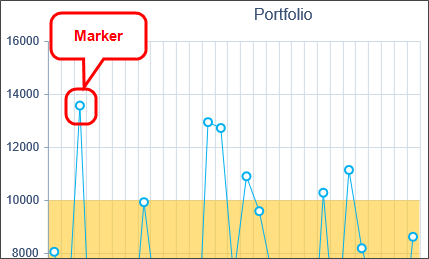
Marker
For certain types of chart, such as line charts, , this option enables you to select the shape of the marker denoting each data point. The options for the marker are:
- Circle
- Cross
- Square
- Triangle
Show Value Labels
Checking this box will display a value label for each data item.
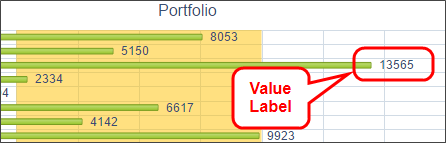
When this setting is checked, a Value Label Template text box appears that enables you to define how the label should appear. The template requires the use of chart syntax to display the values you wish to display. The values are denoted by Chart keywords. The following Keywords are available:
| KEYWORD | DESCRIPTION |
|---|---|
| value | Returns the point value |
| category | Returns the category name - X Axis value for grouped items. |
| series.name | Returns the name of the series - X Axis value for non-grouped items. |
| percentage | Displays the percentage as a decimal between 0 and 1 – Applies to Pie, Donut and Stacked charts only. |
Keywords must be surrounded with pound (#) symbols and prefaced with an equal (=) sign:
#=value#
Keywords can be combined with other keywords and non-keyword text to create labels:
#=value# #=category#(s)
#=series.name# -- #=value#
Use \n to create a line break in your label
#=series.name#: \n #=value#

Numbers contained in the series label can use Telerik's Kendo Formatting extensions to specify the number's format. Some examples of the syntax might be:
| FORMAT | DESCRIPTION |
|---|---|
#=value.format("N3")#
|
Produces a number with 3 decimal places |
#=value.format("C0")#
|
Produces a currency value with 0 decimal places |
#=kendo.format(\'{0:p2}\',percentage)#
|
Formats the percentage value as a percentage with 2 decimal places |
Available Formats
| FORMAT | DESCRIPTION |
|---|---|
| N | Number (e.g. the number 10500 will be formatted as 10,500.00). |
| C | Currency (e.g. the number 10500 will be formatted as $10,500.00) note: Process Director automatically formats all values stored as currency using the "C" identifier. |
| P | Percentage (e.g. the number 10500 will be formatted as 1,050,000.00% because 1 is equal to 100%) |
| E | Exponential (e.g. the number 10500 will be formatted as 1.05e+4) |
Conditional Logic
You can use if statements to apply label values conditionally with the following syntax:
#if (condition) {# expression #} else {# expression #}#
Example
# if ( value == "0" ){# No Hours #} else {# #=value# Hours #}#
If the value is "0" the label displays "No Hours"; otherwise, the value displays as "X Hours", where X is the number of hours.
Other Documentation
For more information about Kendo UI Templates, see Telerik's documentation on the Kendo UI.
Show Tooltip
You can display a tooltip that will appear when users mouse over the chart. If you select this option, the Tooltip Template text box will appear, into which you can enter the template for the tooltip's text, just as you did with Value Labels.
Drill down target
You can set a drill down target that will appear when you click on the data series. You can choose to show the drill down data in a content object such as a Knowledge View, or at a custom URL. If you choose a Content Object for the drill-down data, the Content Picker will appear to enable you to select the desired object. Similarly, if you choose a custom URL, a text box will appear, into which you can type the URL for the Drill down target. For users of Process Director v5.26 or higher, the drilldown URL can contain system variables, which will be parsed and replaced by the appropriate text at run-time.
For Gantt Charts in Process Director v6.0.205 and higher, the Drill-Down Target is generated automatically by referencing the Form Instance from which the data is generated.
Additionally, you can direct where the drill down object will appear by selecting it from the Drill down opens dropdown that offers the following options:
- Popup: A popup window will display the drill down object.
- Replace: The current chart will be replaced in its location by the drilldown object.
- Above: A split screen will appear, displaying the drill down object above the original chart.
- Below: A split screen will appear, displaying the drill down object below the original chart.
- Left: A split screen will appear, displaying the drill down object to the left of the original chart.
- Right: A split screen will appear, displaying the drill down object to the right of the original chart.
- Portlet 1: If the original chart appears in a workspace portlet, the object in Portlet 1 will be replaced by the drill down object.
- Portlet 2: If the original chart appears in a workspace portlet, the object in Portlet 2 will be replaced by the drill down object.
- Portlet 3: If the original chart appears in a workspace portlet, the object in Portlet 3 will be replaced by the drill down object.
- Portlet 4: If the original chart appears in a workspace portlet, the object in Portlet 4 will be replaced by the drill down object.
If you select a portlet that doesn't exist in the workspace, the drill down object will appear in a popup window.
When using the Chart in a Dashboard instead of a Workspace, the "portlet" selections above can also be used to open a Dashboard portlet as the target by configuring the Name property of the Dashboard portlet to match the portlet you select in the Drill down target property of the chart series. For example, if you select the "Portlet 1" selection from the Drill down Target dropdown, you can change the Name property of another Dashboard portlet to "Portlet 1"and the renamed portlet will be used as the dropdown target for the chart series.
When using the drill-down feature of a chart series, the Chart object can pass a series of variables to the drill-down object. For example, you may want to use a Knowledge View as a Drill-Down object, so that when you click on a chart's data series, Process Director opens a Knowledge View containing a logical view of the series data. In order for this to work properly, you must pass the appropriate variables to the Knowledge View's to filter the data. The Chart, therefore, passes the following variables to drill-down objects.
bpcCategory: The Category of a Data Series, taken from the Group By field, if any.
bpcSeriesType: The Series Type of a chart Data Series, i.e., Bar Column, Pie, etc.
bpcSeriesName: The Series Name of a chart Data Series. This will be the name of the series from the Series Name property if you've given the series a name, or the field name of the series if you've not entered a Series Name. This is the value that is displayed in the Chart's Legend for the series.
bpcValue: The value of the Data Series.
bpcPercentage: The percentage value of the Data Series in decimal format. This variable is only available with Pie, Doughnut and 100% Stacked charts.
 Sometimes, variables must be passed through multiple objects before reaching a Knowledge View, or other object. For instance, you may have a Form that calls a Chart, which, in turn, calls a Knowledge View via a drill-down. The data on the Form is passed to the Chart via a variable that is accessed using the normal
 {VAR:ParmName} syntax. However, when the chart does a drill-down to a Knowledge View, the Knowledge View does not have access to the original {VAR:ParmName} variable. Instead you need to append two underscores and the number "2" (__2) to the variable name, e.g. {VAR:ParmName__2}. When you do so, Process Director treats the "{VAR:ParmName__2}" in the in the Knowledge View as a pointer to the original value for {VAR:ParmName}, so that the proper value is automatically available to the Knowledge View.
Drill-down Variables Implementation Example
Let's assume that we want to use a Knowledge View as the data source for our charts. Any of the variables listed above can be used directly in the Filter tab of a Knowledge View as variables. Here's a simple example:

The Chart will pass the variable values automatically, and a simple Knowledge View will return the correct data based on the filters that get passed via the variables.
But, now let's look at a more complex scenario. For this next example, let's assume we have a Knowledge View that returns some information about a fleet of vehicles. As part of this information, the Knowledge View has a Mileage column for each vehicle the Business Value returns. This Mileage column gets its data from a Business Value that returns the mileage for a specific vehicle. The Business Value has two parameters, the Location and the Vehicle, from which it determines what vehicle to use to return that vehicle's mileage to the Knowledge View column. The underlying Business Value for the Mileage column might be configured like this:
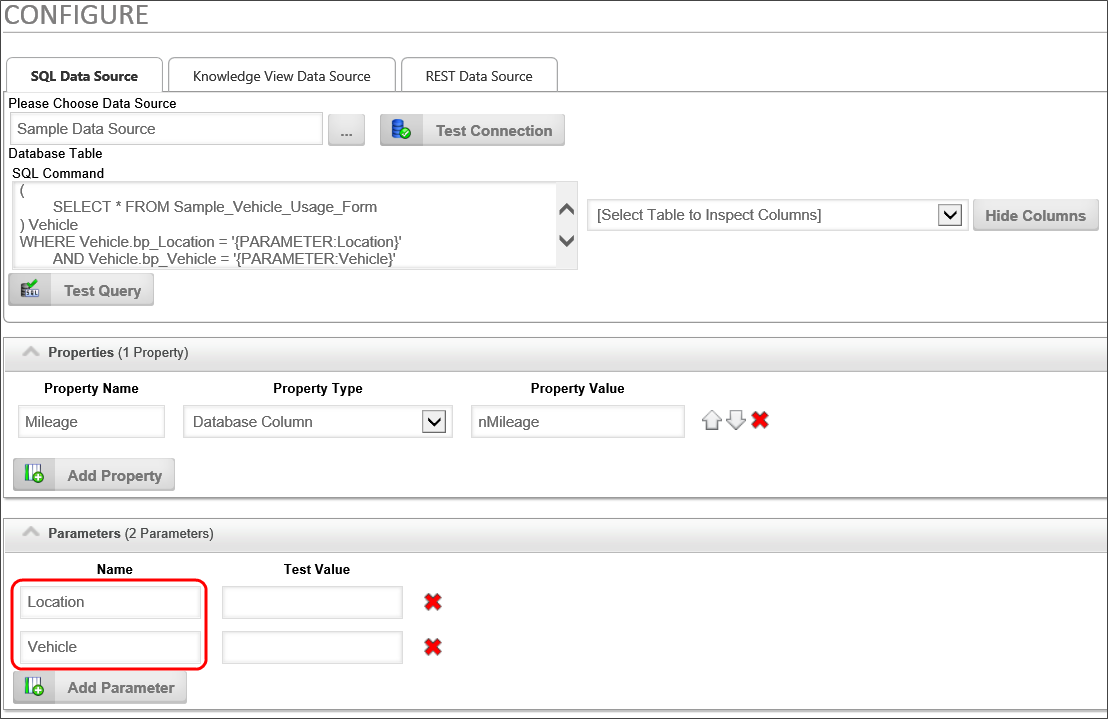
So, how do we make this return the proper data to the Knowledge View's Mileage column?
In the Columns tab of the Knowledge View, when you configure the Business Value to use for the Mileage column, you can use a Chart Variable as one of the Business Value's parameters, as shown below.
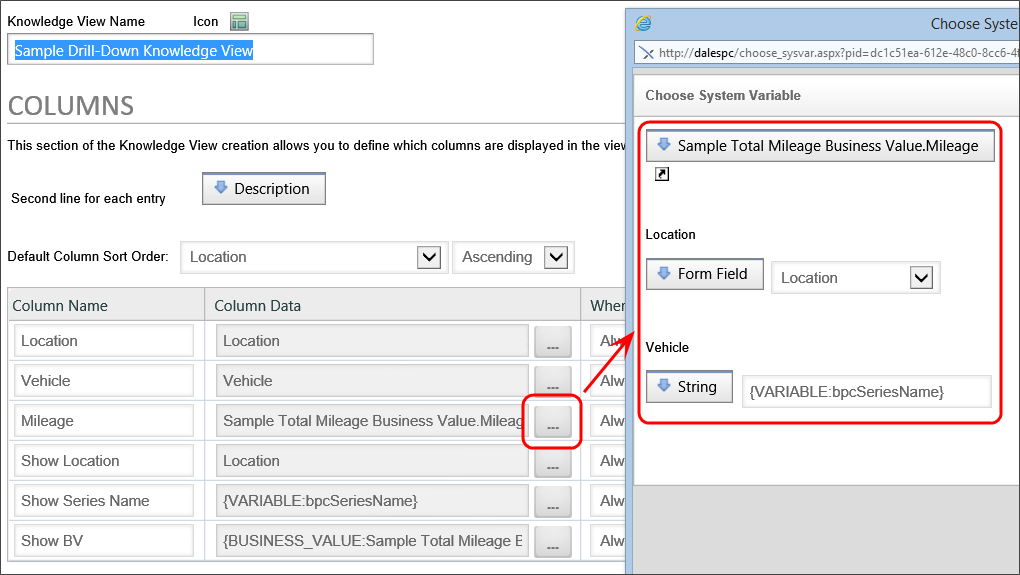
The Chart will pass the bpcSeriesName variable to the Knowledge View, which will, in turn, pass it along to the underlying Business Value as a parameter, so that the mileage for the specified vehicle is returned from the Business Value to populate the Mileage column.
You can add additional series from your data source by clicking the Add Series button.
Chart Ranges Tab #
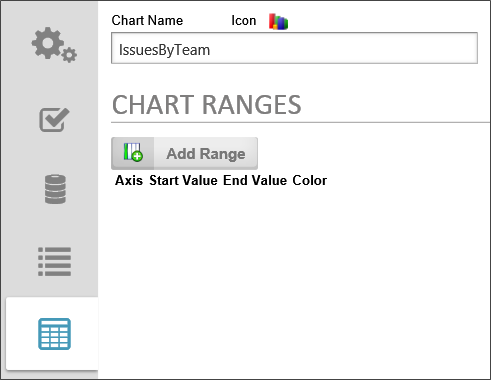
This configuration section enables you to modify the chart display to add different colors to specified ranges of the chart's background.
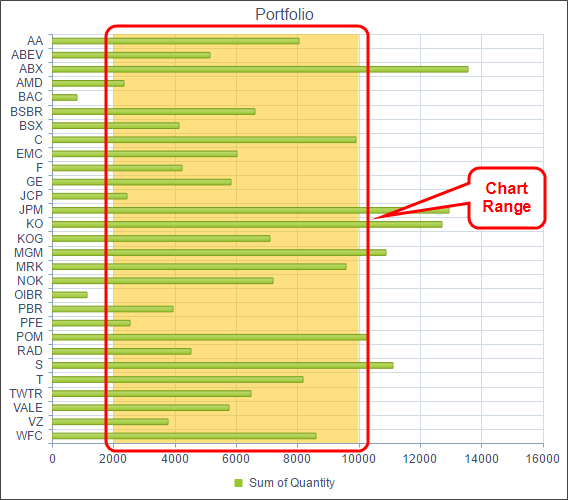
Axis
Enables you to set the range on the primary or secondary axis.
Start Value
The value that begins the range.
End Value
The Value that ends the range
Color
Enables you to set the color for the range.
Additional ranges can be added by clicking the Add Range button. The range entries can be orders by clicking the up/down arrows on the right side of the tab, and a range can be deleted by clicking the red "X" icon.
Documentation Feedback and Questions
If you notice some way that this document can be improved, we're happy to hear your suggestions. Similarly, if you can't find an answer you're looking for, ask it via feedback. Simply click on the button below to provide us with your feedback or ask a question. Please remember, though, that not every issue can be addressed through documentation. So, if you have a specific technical issue with Process Director, please open a support ticket.